Read the VEXA Score breakdown
Statistics, streaks, score distribution and the history chart, with the formula behind each figure.
On this page
What this does
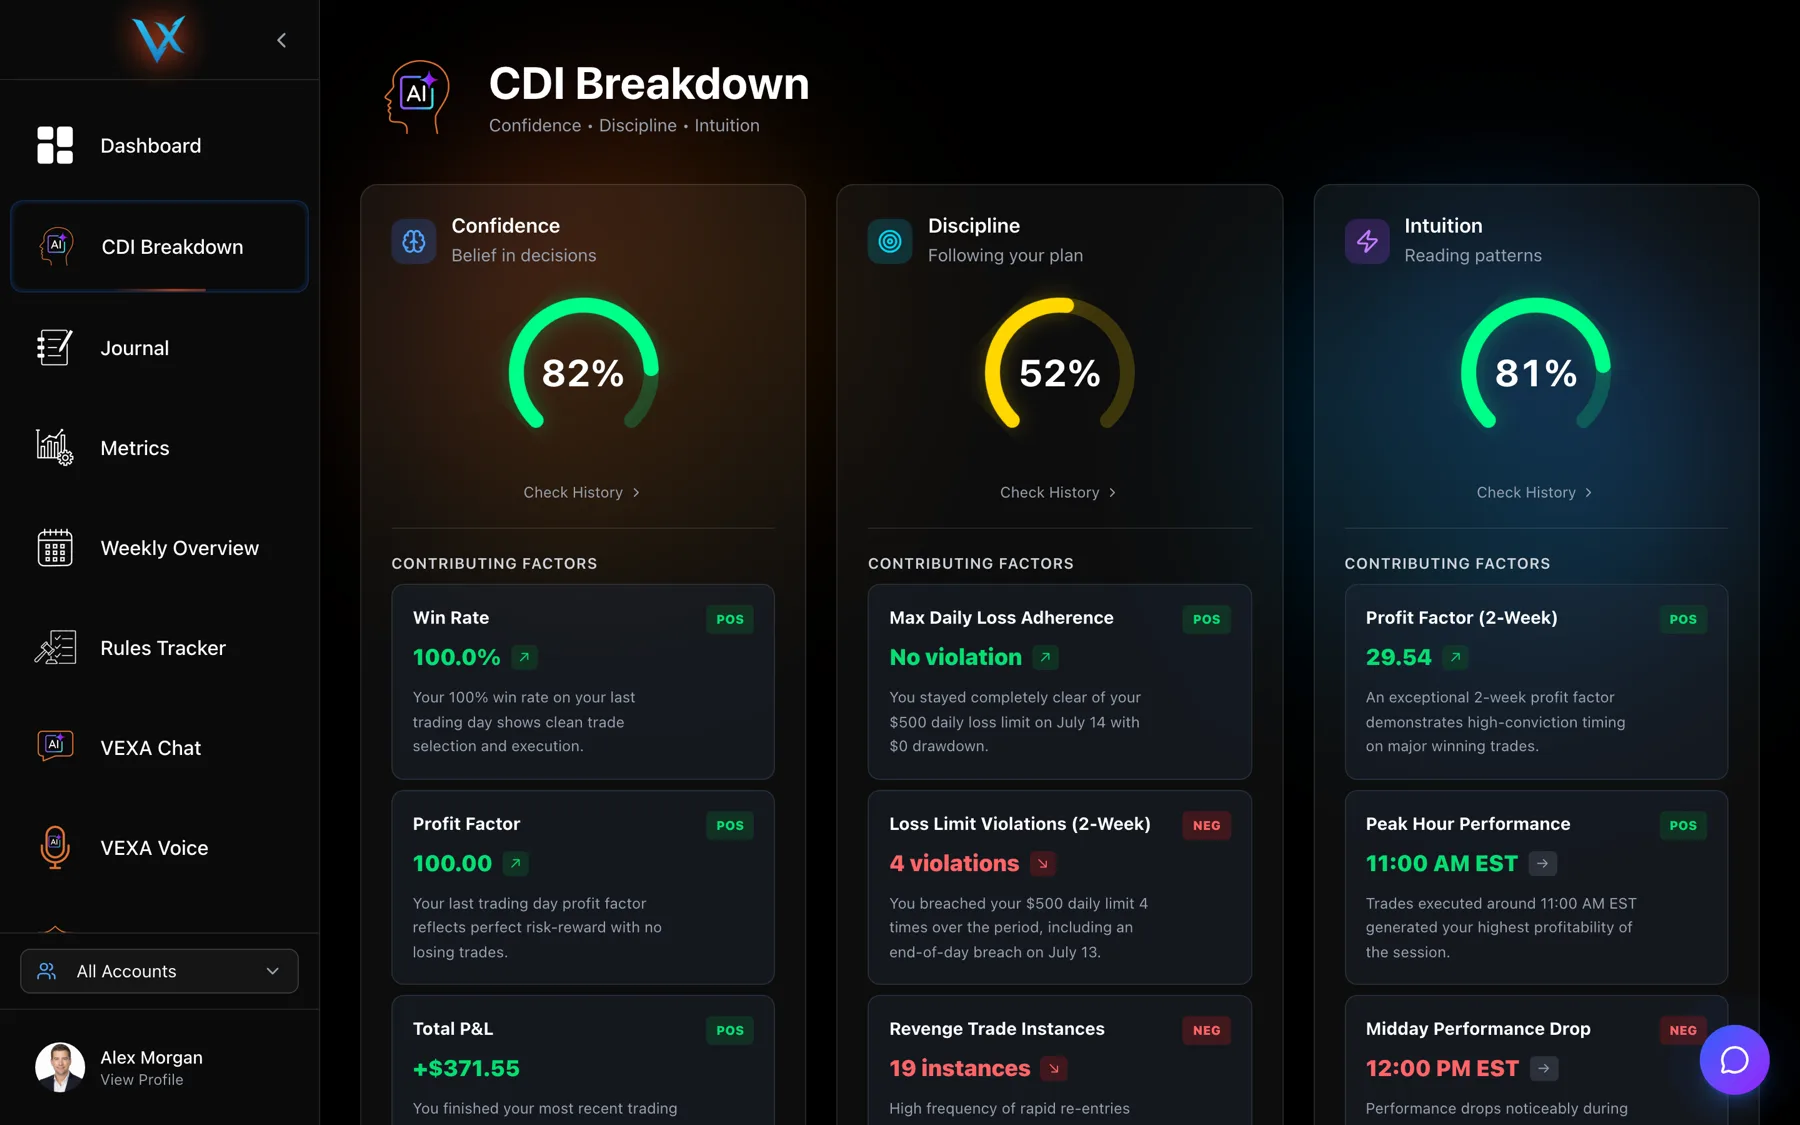
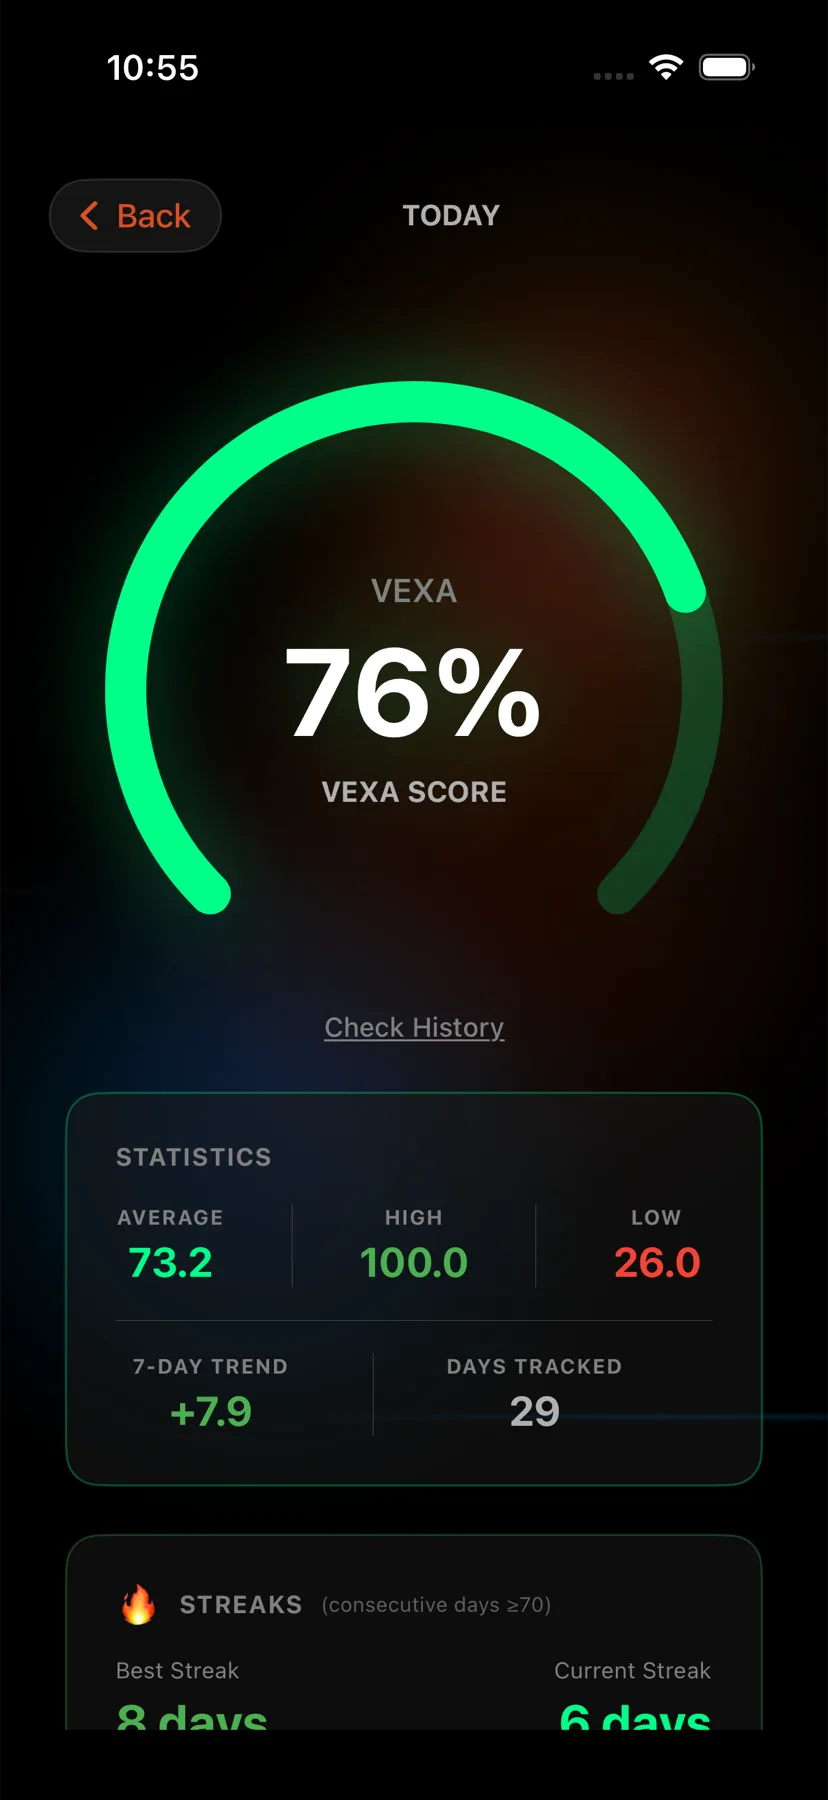
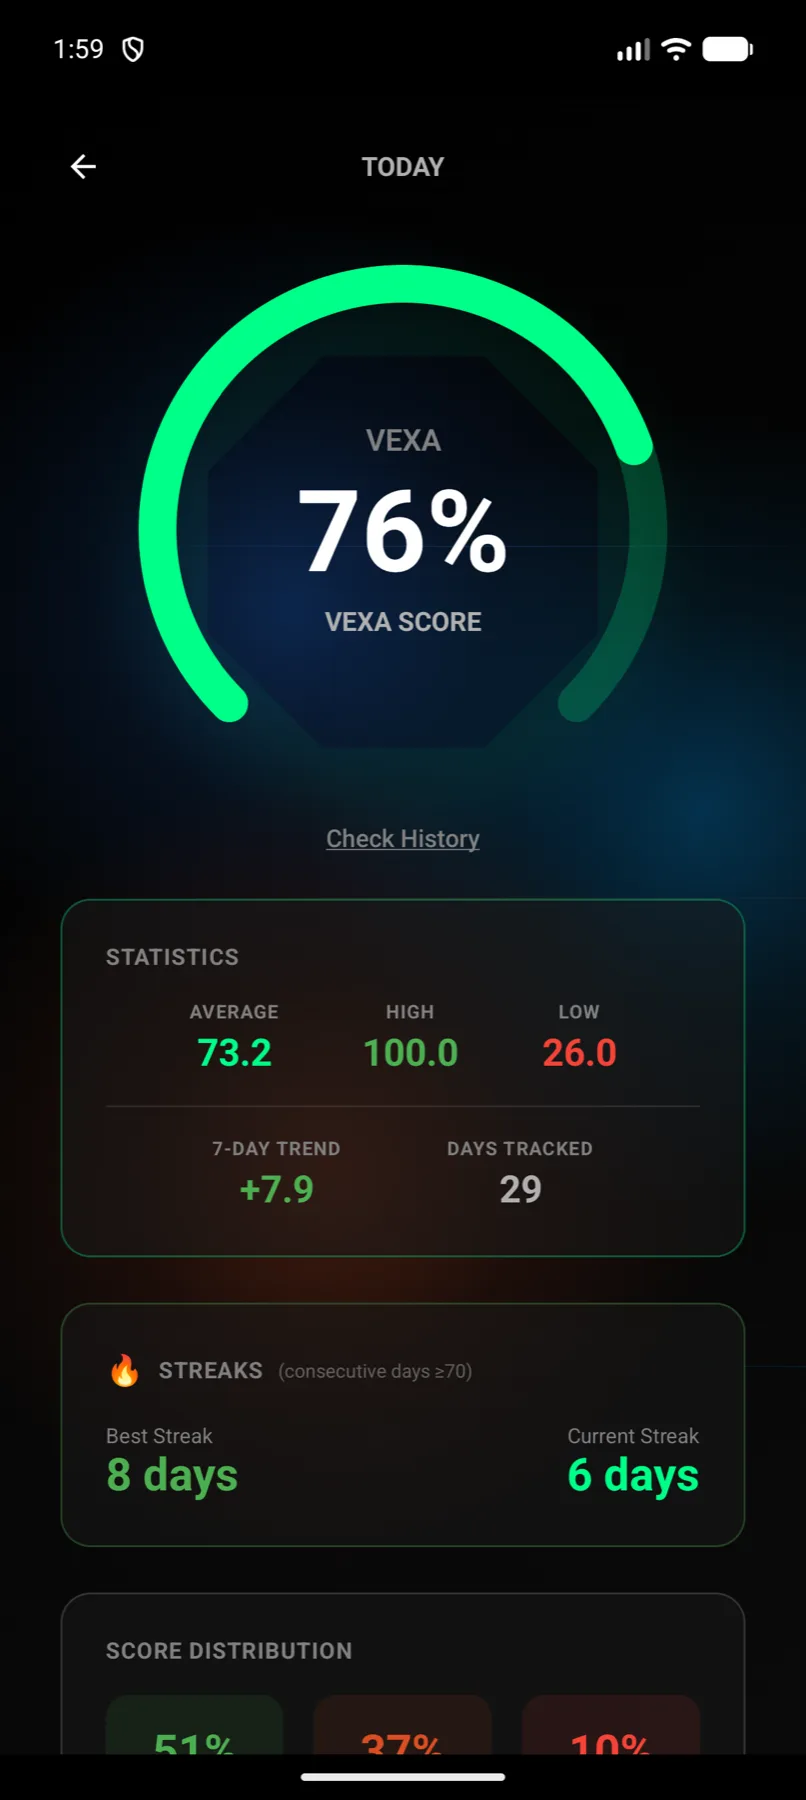
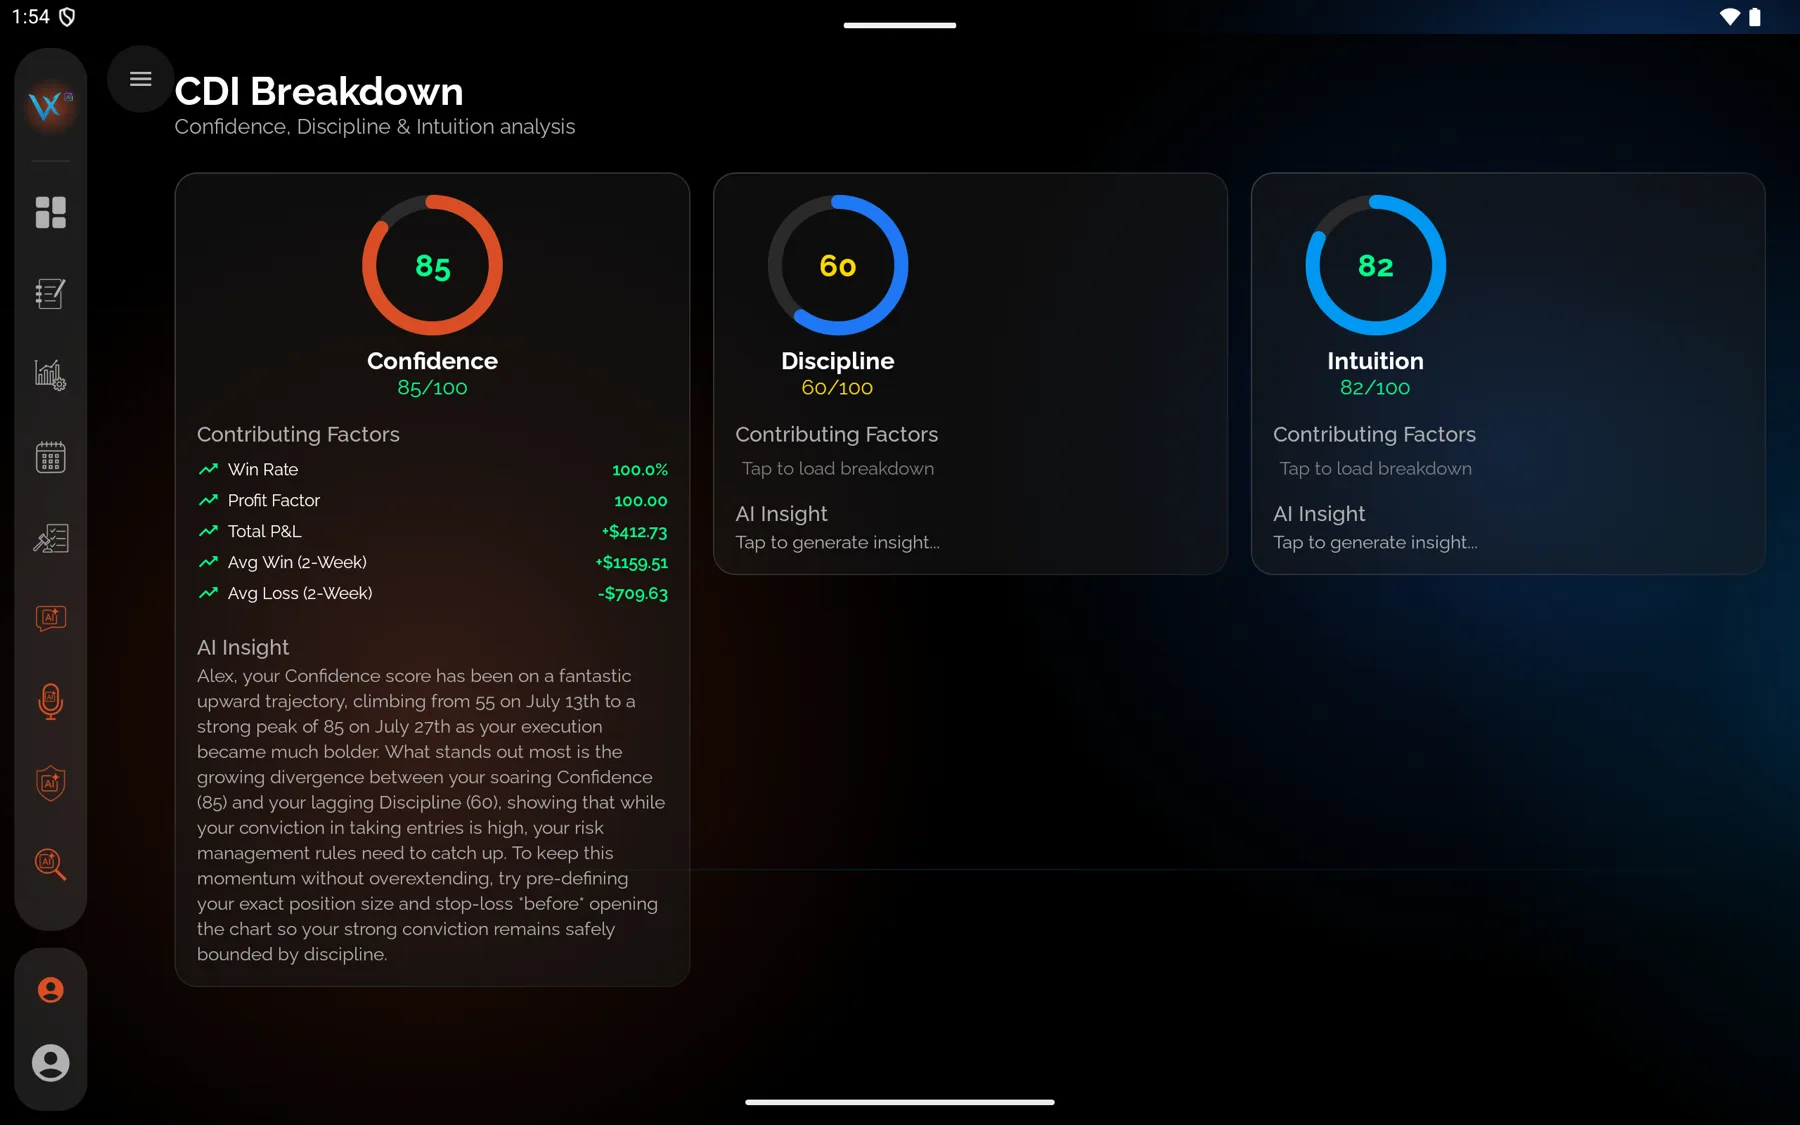
The breakdown is the detail view behind the big score gauge. It holds your score history, four summary statistics, your streaks, the spread of your scores into bands, and the AI’s written reasoning.
Before you start
The breakdown needs Pro. Edge (Free) still shows your score number on the dashboard gauge, but this detail view, the history chart, statistics, streaks, score distribution and the AI’s written reasoning, is Pro only.
The history is only as long as your account. A new account shows a single point until it has a few days behind it.
Steps
- Open Dashboard from the sidebar.
- Click the large speedometer.
- Read Current Score, then Statistics, Streaks and Score Distribution.
- Scroll to Historical Trend for the chart.
- Open the Home tab, the house icon at the far left of the bar at the bottom.
- Tap the large score gauge.
- Read the ring, then STATISTICS, STREAKS and SCORE DISTRIBUTION.
- Tap Check History for the full trend chart. Drag along it to read individual days.
- Open Dashboard from the sidebar.
- Tap the large score gauge.
- Read the ring, then STATISTICS, STREAKS and SCORE DISTRIBUTION.
- Tap Check History for the full trend chart.
- Open the Home tab, the house icon at the far left of the bar at the bottom.
- Tap the large score gauge.
- Read the ring, then STATISTICS, STREAKS and SCORE DISTRIBUTION.
- Tap Check History for the trend chart, which has Daily, Weekly and Monthly tabs.
- Swipe right anywhere on the page to go back.
- Open Dashboard from the sidebar.
- Tap the large score gauge.
- Read the ring, then STATISTICS, STREAKS and SCORE DISTRIBUTION.
- Tap Check History for the trend chart.
Every figure, and where it comes from
Statistics
| Row | What it is |
|---|---|
| Average | The mean of every score in your history |
| High | Your highest recorded score |
| Low | Your lowest recorded score |
| 7-Day Trend | The change described below |
| Days Tracked | The number of days that have a score at all |
The 7-day trend compares two windows:
with 14 or more days:  change = mean(last 7 days) − mean(the 7 days before those)
with 2 to 13 days:     change = newest score − oldest score
The arrow points up when the change is greater than +1, down when it is less than minus 1, and reads as stable in between. A one-point wobble is not treated as a direction.
Streaks counts consecutive days at 70 or above.
a day counts towards a streak when its score ≥ 70Best Streak is the longest such run anywhere in your history. Current Streak counts back from your most recent scored day and stops at the first day below 70.
Score Distribution splits your history into three bands and reports each as a whole percentage.
| Band | Range |
|---|---|
| Excellent | 75 and above |
| Good | 50 to 74 |
| Needs Work | below 50 |
Note that the streak threshold is 70 and the Excellent band starts at 75. They are different lines and always have been.
What you should see
A ring showing today’s score, four statistics, two streak numbers, three percentages that add to roughly 100, and a chart you can scrub.
Underneath, the AI’s own reasoning about your overall score and a list of key insights. On the web the whole view is cached for the session against your current account filter, so returning to it is instant.
If it doesn’t work
- The chart is empty. The apps say “No historical data available” with “Start syncing your trades to see trends”. You need at least one scored day.
- Your current streak is 0 but your best is 12. The most recent scored day fell below 70, which ends the current run immediately.
- The distribution percentages do not add to exactly 100. Each one is rounded independently.
- Changing your account filter changed the history. It should. The breakdown is scoped to the accounts you have selected.
Related
Still stuck? Email support@vexatrade.ai.