How Confidence is calculated
What Confidence measures, the thresholds the model uses for win rate and profit factor, and the exact formulas behind the four rows on the Confidence tab.
On this page
What this does
Confidence asks one question: do you have an edge, and do you back it? It is the largest part of the VEXA Score, suggested at 40 per cent of the composite.
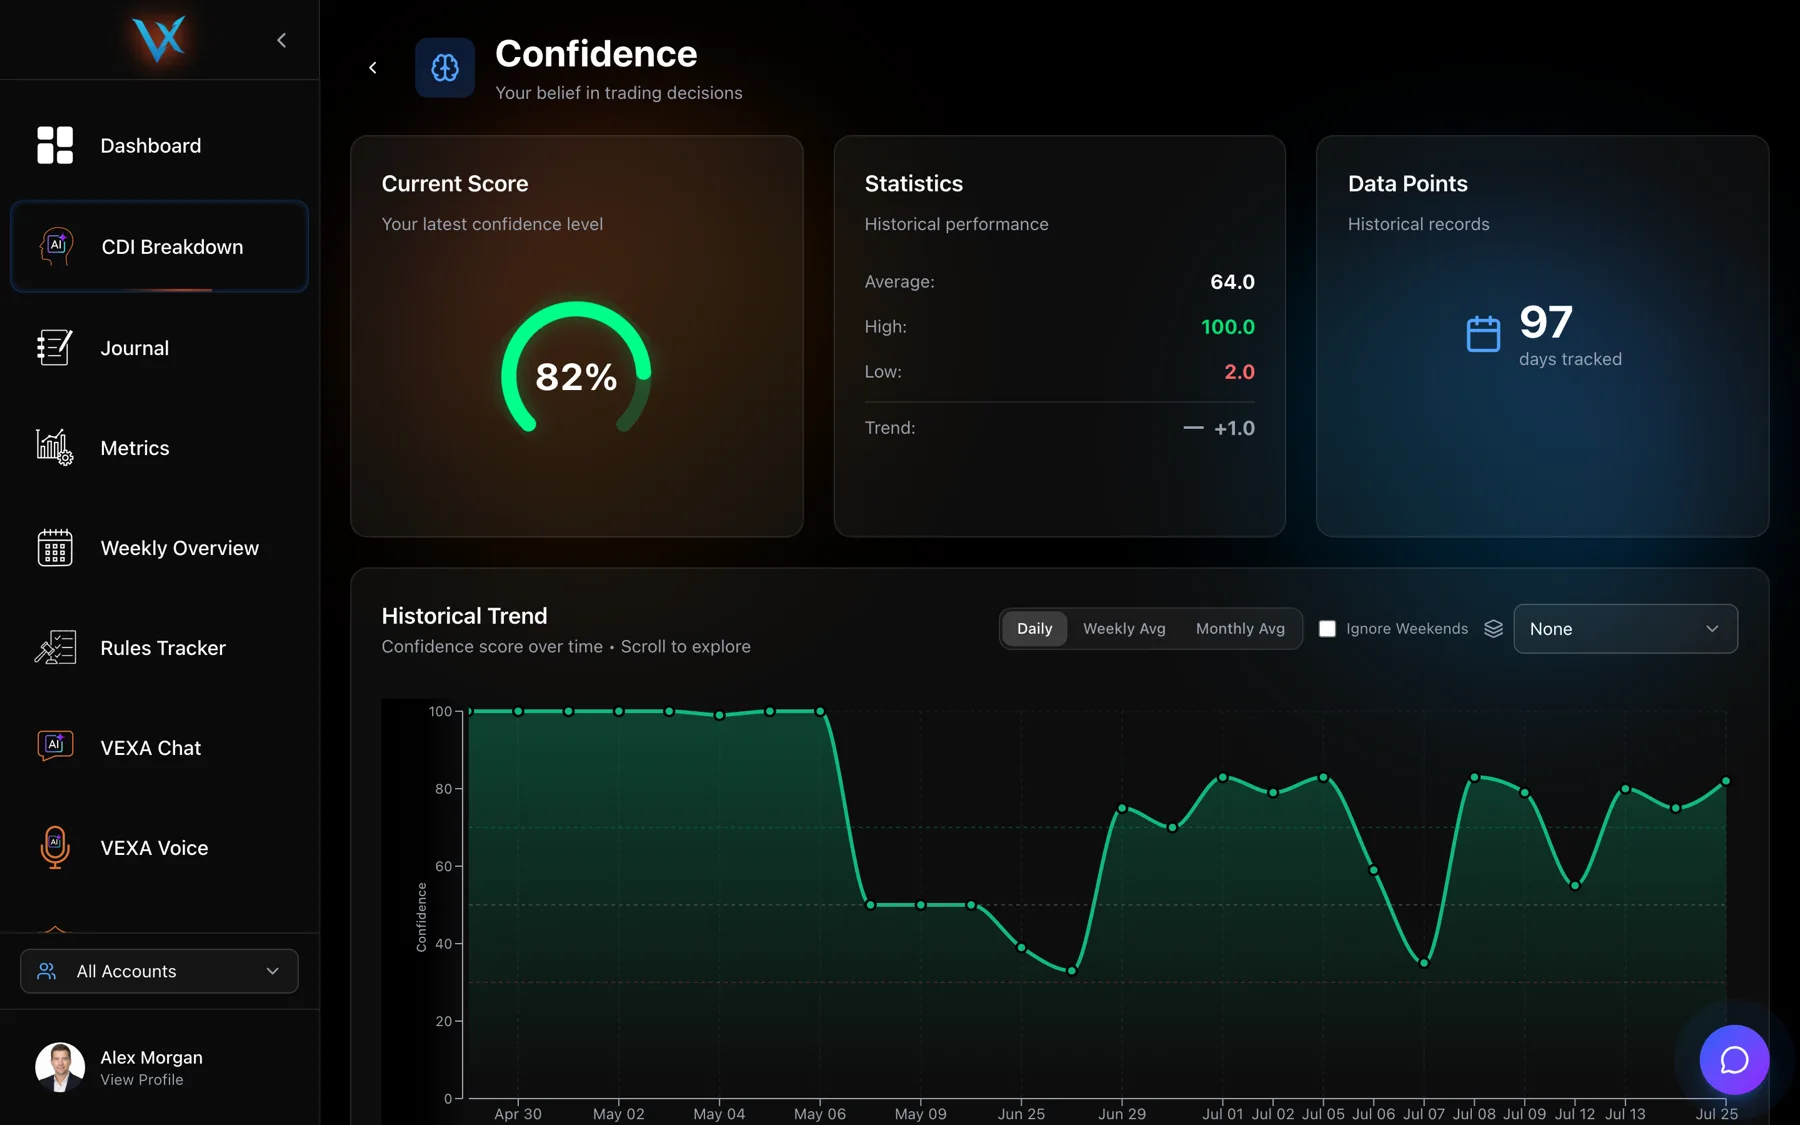
What the model weighs
Confidence is produced by VEXA’s AI rather than by a fixed formula, and the scoring guidance it works from is specific.
Win rate, judged against your trading style. The same percentage means different things to different traders:
| Style | Win rate the model reads as good |
|---|---|
| Scalping | 40 to 55 per cent |
| Day trading | 50 to 65 per cent |
| Swing trading | 55 to 70 per cent |
Profit factor, on a fixed scale: 2.0 and above is excellent, 1.5 to 2.0 is good, 1.0 to 1.5 is acceptable, and below 1.0 is treated as a problem.
Average P&L, where positive expectancy matters more than the size of any one day, and a rising trend counts for more than a flat one.
Consistency, meaning low variation in daily P&L. Steady beats spiky at the same total.
Direction, meaning whether the recent trading days are improving or deteriorating.
The model is told to be adaptive rather than mechanical. A trader with a 45 per cent win rate and a 3.0 profit factor is scored as highly confident, because the risk-to-reward is doing the work. A trader with a 70 per cent win rate and a 0.8 profit factor is not, because the losers are being allowed to run.
The four rows on the Confidence tab
The Confidence tab of the CDI breakdown shows four component rows. These are an explanation computed on your device over the last five trading days. They do not produce the score. The score comes from the AI. Expect the two to agree in direction and not always in level.
| Row | Weight label shown | The value | Arrow up when | Arrow down when |
|---|---|---|---|---|
| WIN RATE | 25% weight | round(winRate)% | 60 or more | below 40 |
| PROFIT FACTOR | 35% weight | profit factor to 2 decimals | 2.0 or more | below 1.0 |
| AVG P&L | 20% weight | Σ P&L / trades, rounded to the dollar | 50 dollars or more | below 0 |
| CONSISTENCY | 20% weight | round(consistency)% | 70 or more | below 50 |
Consistency has an actual formula:
CV          = standard deviation of trade P&L / |mean trade P&L|
consistency = (1 − min(CV, 2) / 2) × 100
A coefficient of variation of 0 gives 100 per cent. A coefficient of 2 or worse gives 0 per cent. Fewer than two trades in the window returns a flat 50, because there is nothing to measure variation against.
Where to find it
- Open CDI Breakdown from the sidebar.
- Choose the Confidence tab.
- Read the ring, then the component rows underneath.
- Open the Home tab, the house icon at the far left of the bar at the bottom.
- Tap the ring labelled CONFIDENCE.
- Read the ring, the contributing factors and the insight.
- Open Dashboard from the sidebar.
- Tap the ring labelled CONFIDENCE.
- Read the ring, the contributing factors and the insight.
- Open the Home tab, the house icon at the far left of the bar at the bottom.
- Tap the ring labelled CONFIDENCE.
- Read the ring, the contributing factors and the insight. Swipe right anywhere on the page to go back.
- Open Dashboard from the sidebar.
- Tap the ring labelled CONFIDENCE.
- Read the ring, the contributing factors and the insight.
What you should see
A number to one decimal place, four component rows with arrows, a set of AI contributing factors each carrying a weight of critical, high, medium or low, and a written paragraph.
With no trades in the last five trading days, the component list is empty and only the ring and the AI text render.
If it doesn’t work
- The rows disagree with the ring. They are meant to. The rows look at five trading days on your device. The ring comes from the AI, which reads a wider window, your baseline and your prior scores.
- Profit factor shows a very large number. With no losing trades in the window there is nothing to divide by, and the surfaces handle that differently.
- Confidence dropped after a profitable week. Check the consistency row. A week made by one outsized day scores worse than the same total spread evenly.
Related
Still stuck? Email support@vexatrade.ai.