How VEXA calculates every metric
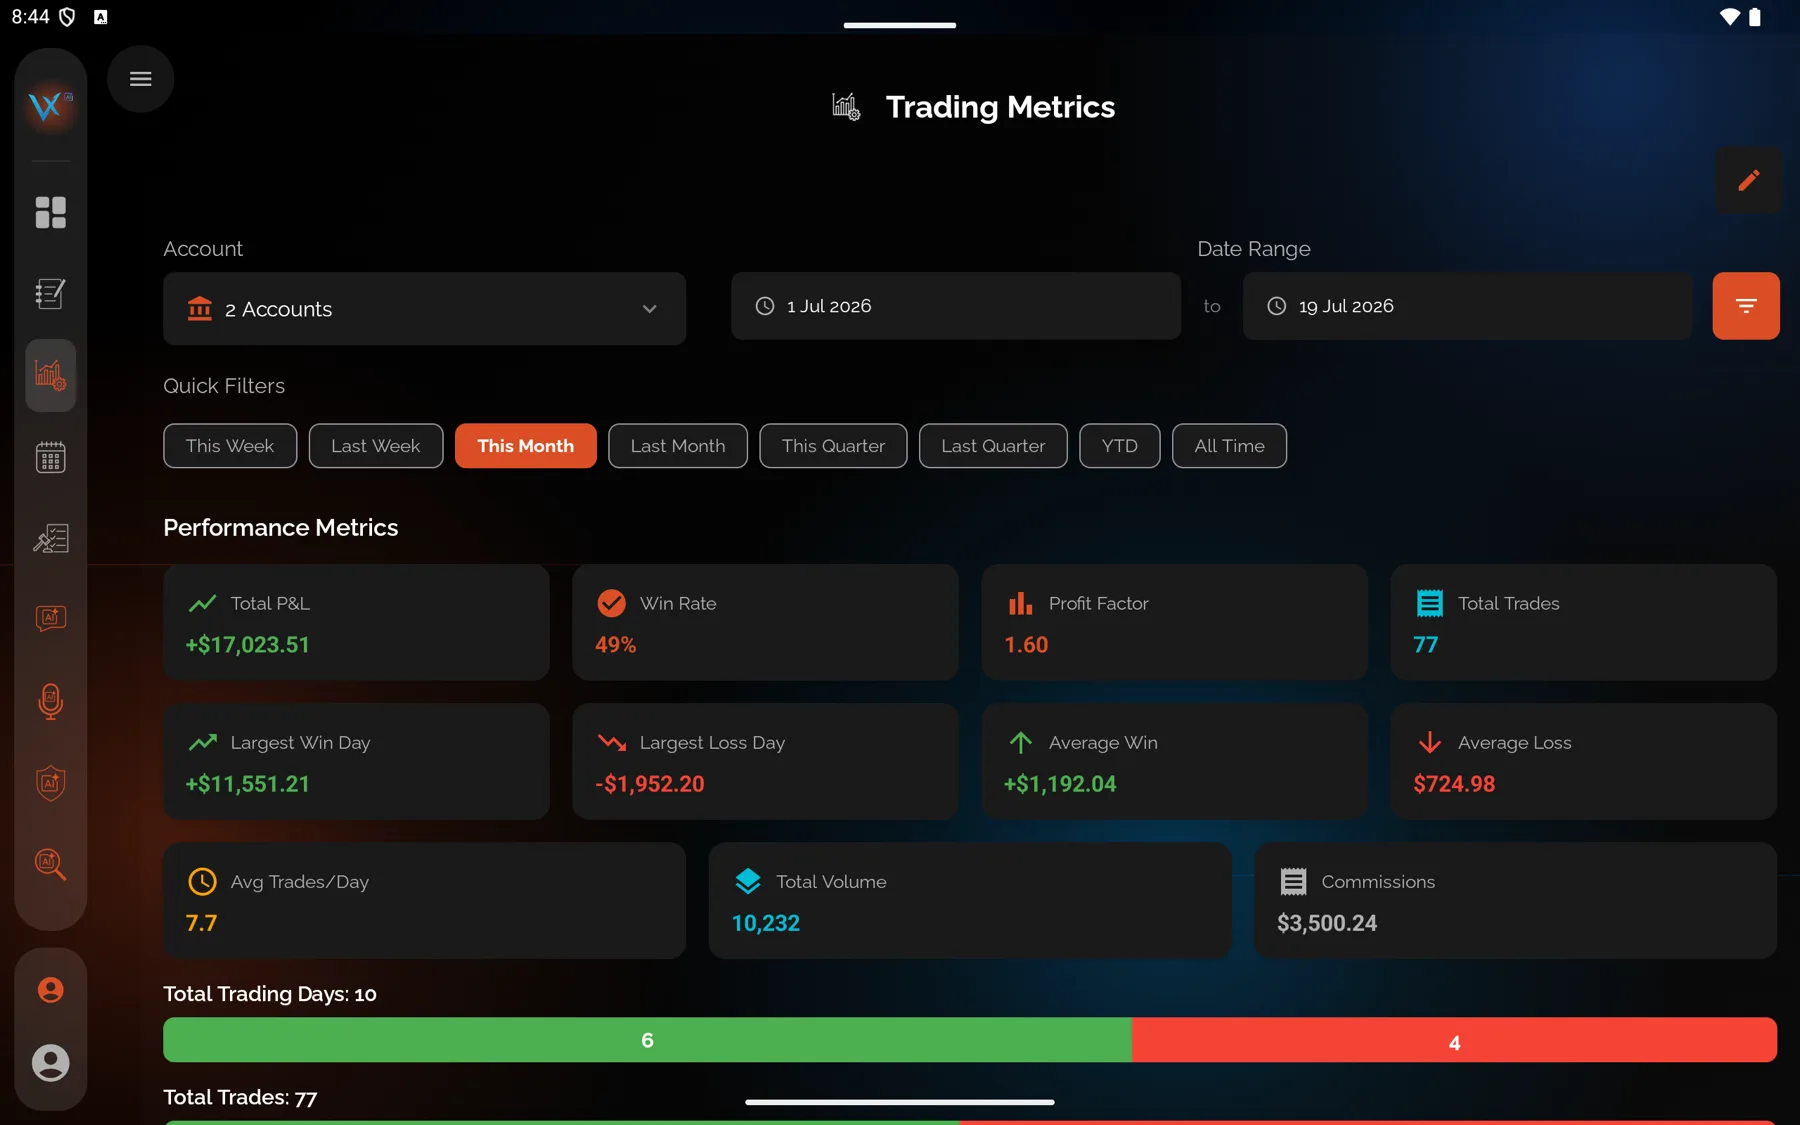
The formula behind every number on the Metrics screen, including profit factor, drawdown, volume, average trades per day and what counts as a green day.
On this page
What this does
This is the reference for every figure VEXA computes from your trades. If a number surprises you, find it here first.
Before you start
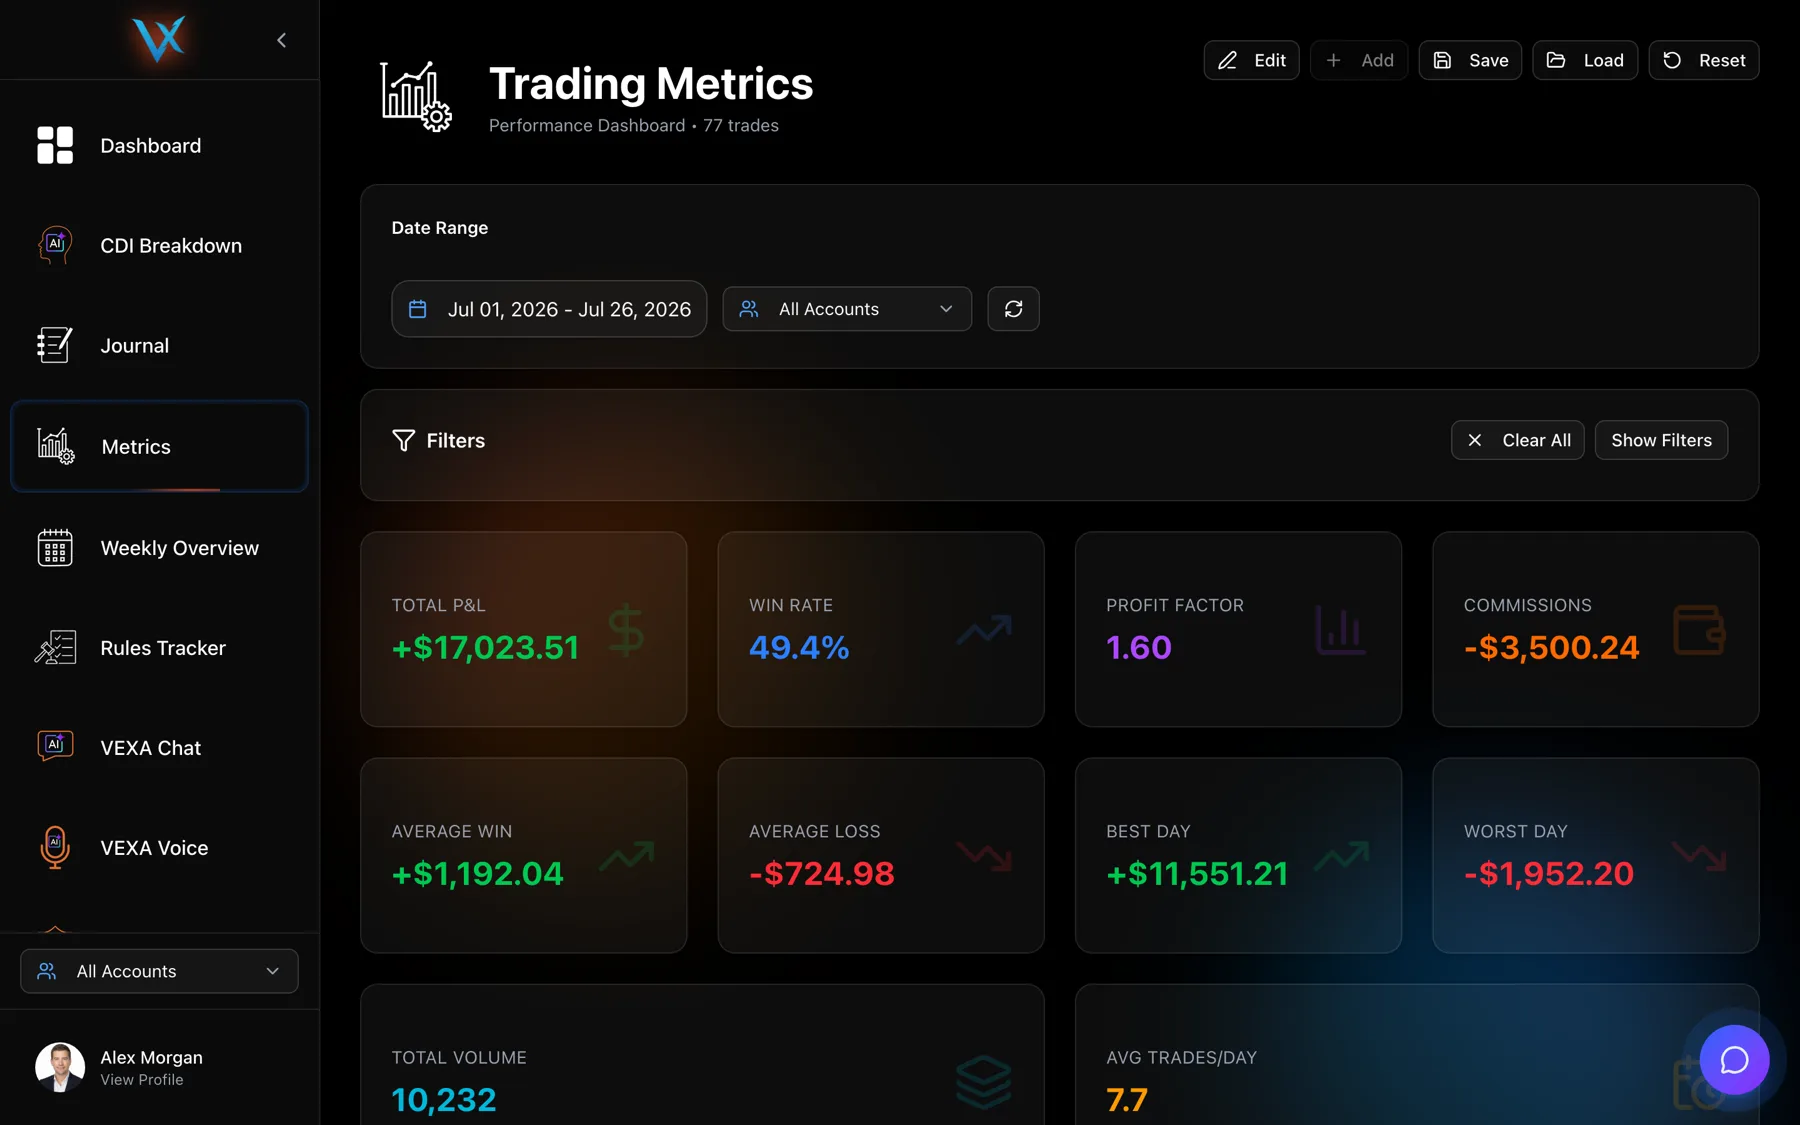
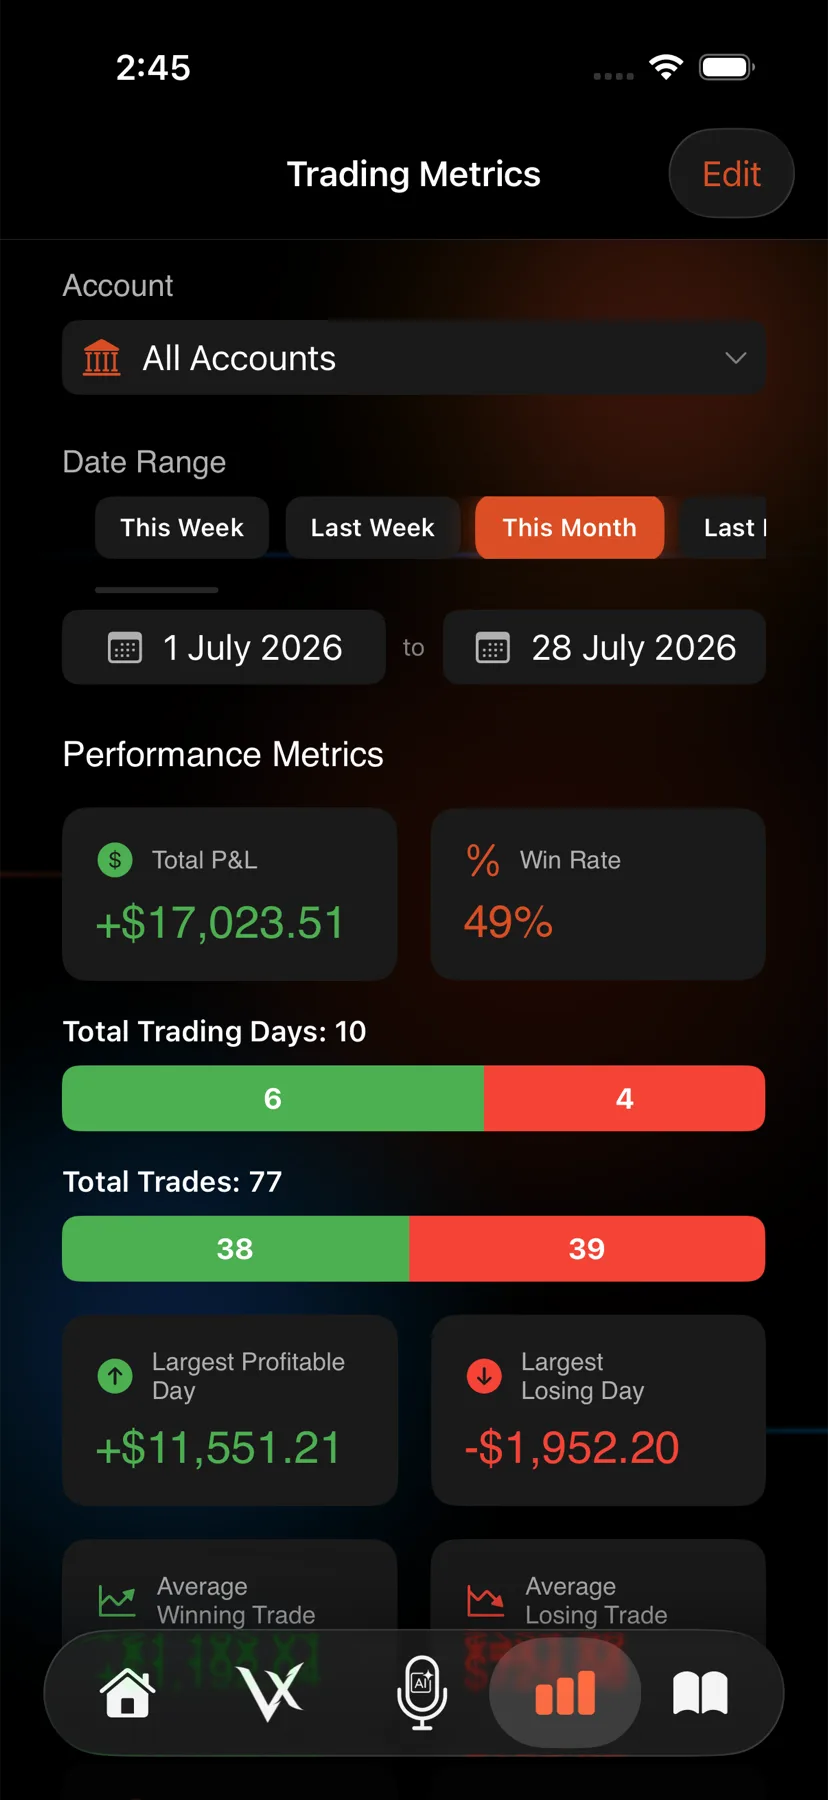
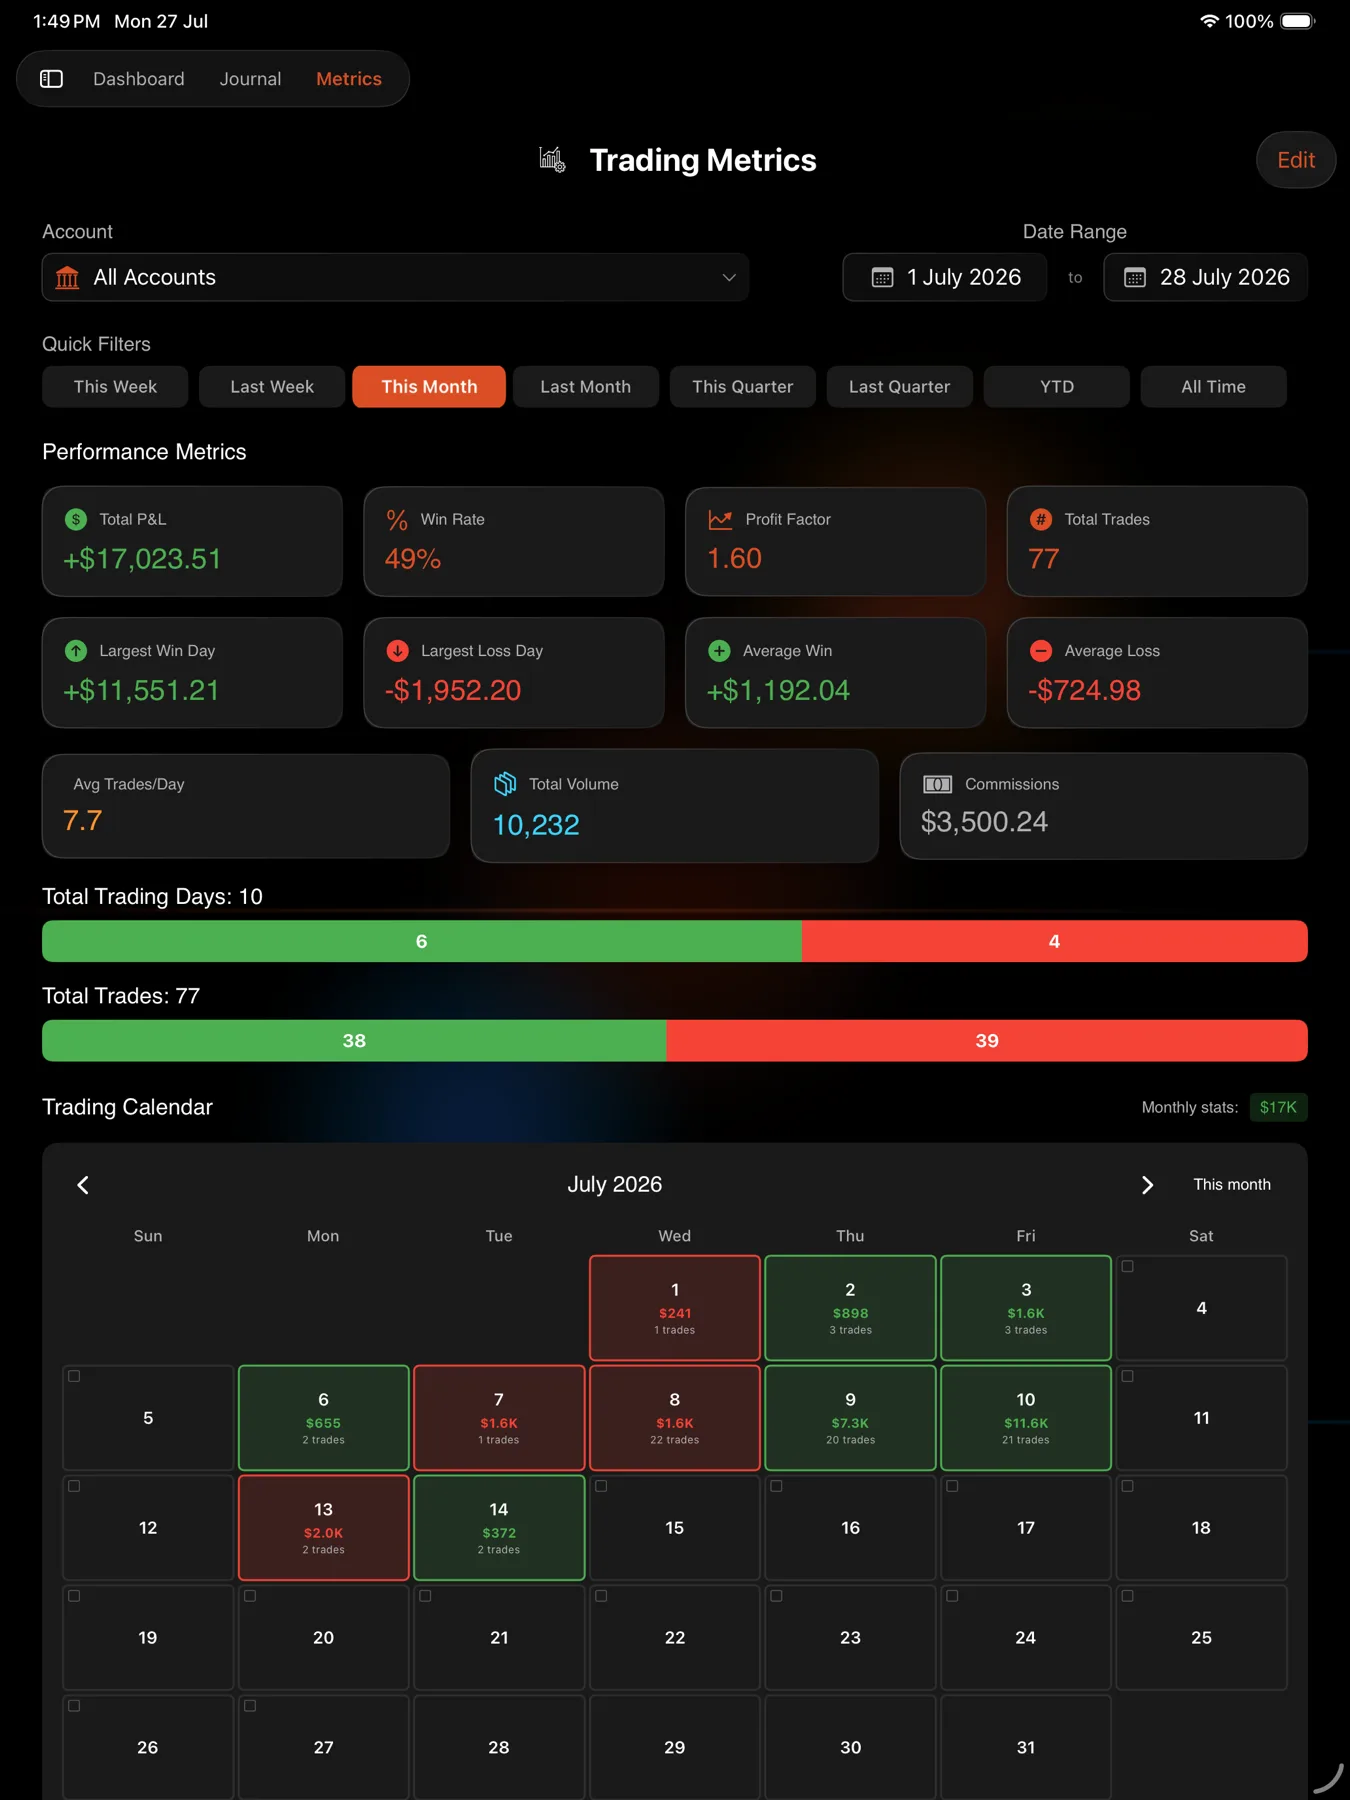
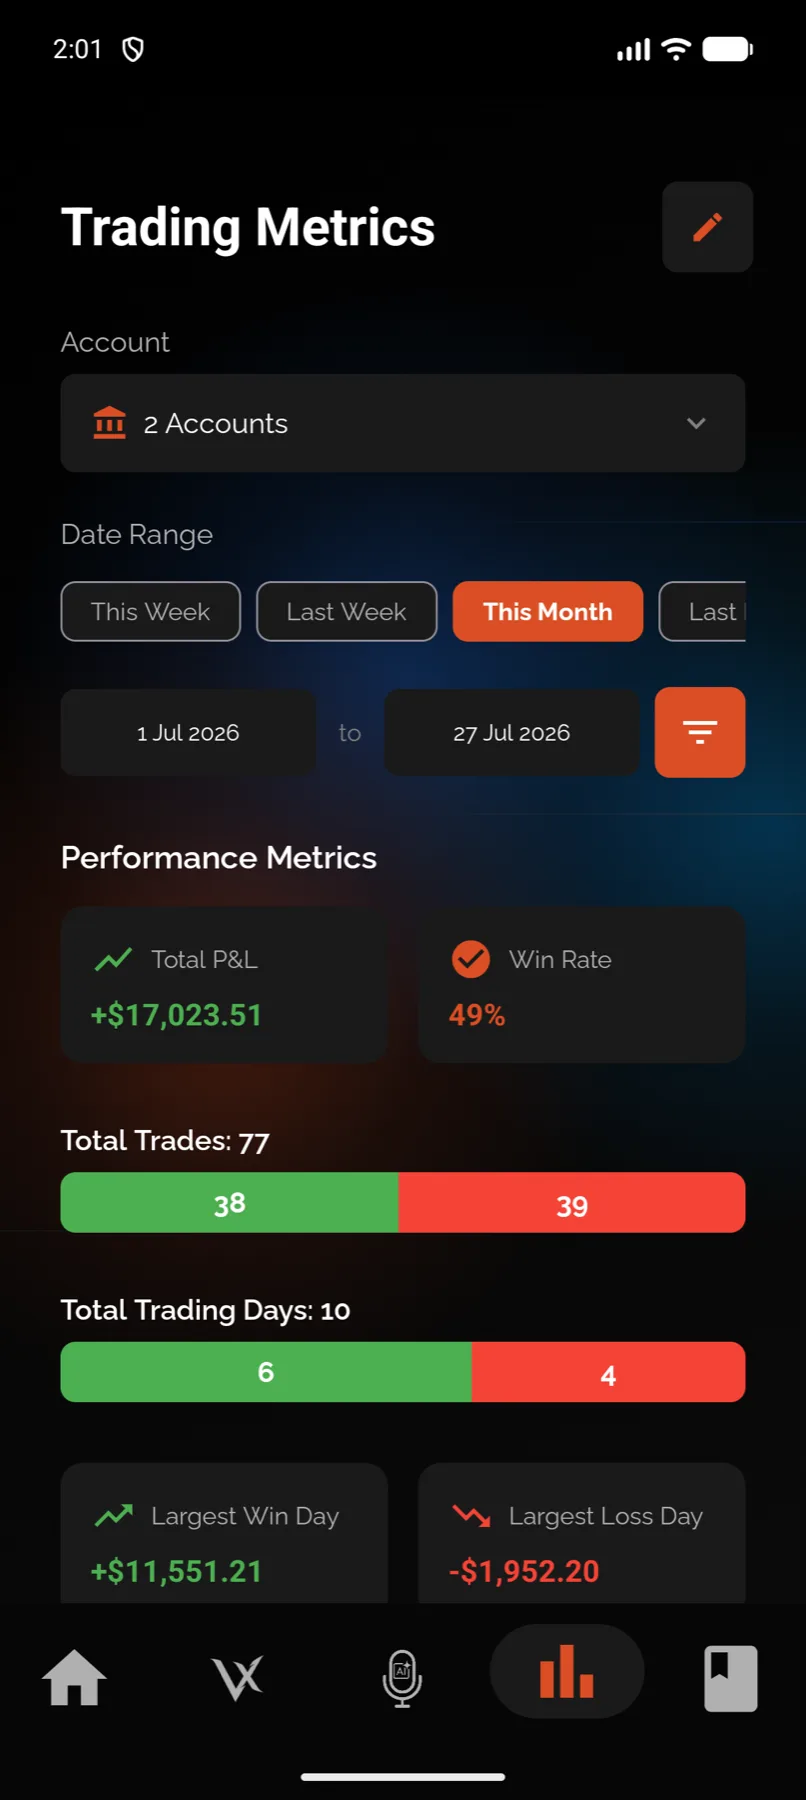
Every formula below runs over the trades inside your current date range and account filter. Change either one and every number changes. Only closed trades are included, unless you deliberately add open positions with the Status filter.
The core numbers
Total P&L is the net money made or lost on closed trades in range, after costs.
total P&L = sum of every trade's P&LCommissions and fees are already inside each trade’s P&L, so nothing is subtracted afterwards.
Win rate is the share of closed trades that made money.
win rate = winning trades / all closed trades x 100The Trades screen uses a different denominator on purpose. See Why two pages show different win rates.
Wins and losses are the counts behind that rate.
wins   = trades with P&L above zero
losses = trades with P&L below zero
A trade that closed at exactly zero is in neither count, but it is still in the win-rate denominator.
Profit factor is how many dollars you made for every dollar you lost.
profit factor = gross profit / gross lossGross profit is the sum of the winners. Gross loss is the sum of the losers, as a positive number. Above 1.00 means the winners outweigh the losers. With winners and no losers at all, the Metrics screen shows the infinity symbol rather than a number. With neither, it shows zero.
Average win and average loss are the means of the two buckets.
average win  = gross profit / number of wins
average loss = gross loss / number of losses
With no winners, the average win cell shows a dash rather than $0. A dash means “there is nothing to average”, which is a different statement from “the average is zero”.
Commissions is the total cost of the trades in range.
commissions = sum of every trade's commissionIt is displayed with a leading minus sign, because it is money that left.
Days
Total trading days is the number of distinct days on which you closed at least one trade. Days you did not trade are not counted, so a month with eleven active days reads 11, not 30.
Best day is your single most profitable calendar day in range. VEXA groups trades by day, sums each day, and takes the highest positive total. In a range where every day lost money there is no best day, so the cell shows a dash rather than the least bad day.
Worst day is the mirror of that, and shows a dash in an all-green range.
Green and red days split your trading days by each day’s net total.
a day is green when its net P&L is zero or aboveA day that nets exactly zero counts as green.
Average trades per day divides by active days, not calendar days.
avg trades per day = total trades / total trading daysForty trades across ten active days reads 4.0, whether those ten days sat inside a week or a quarter.
Curves
Cumulative P&L, the equity curve, is a running total of daily P&L across the range, starting at zero. It is the shape of the range, not your account balance.
Drawdown is how far below your running peak you are, in currency.
walk trades in close-date order
cumulative = cumulative + trade P&L
peak       = the highest cumulative so far
drawdown   = cumulative - peak
Drawdown is therefore zero or negative, never positive, and it only begins once the running peak has gone above zero. A range that never goes into drawdown renders a “no drawdown for this period” state rather than a flat line.
Volume and symbols
Total volume is how many shares or contracts changed hands, counting both sides.
volume = sum of the absolute quantity of every fillWhen a trade has no fill-level data, VEXA falls back to the trade quantity doubled, on the assumption of one entry and one exit.
Symbol win rate, used by the top and bottom symbol lists, is computed per base symbol. Option contracts are rolled up into their underlying, so every TSLA option sits under TSLA rather than appearing as dozens of separate strikes.
Trade-level numbers
These appear on an individual trade rather than on the Metrics screen.
Return % measures against what the trade cost to put on, not against your account.
return % = P&L / (entry price x quantity x contract multiplier) x 100The multiplier is 100 for options and 1 for stock. Futures use the contract’s own multiplier.
Price change % is direction-aware.
long  = (exit - entry) / entry x 100
short = (entry - exit) / entry x 100
A profitable short therefore shows a positive percentage.
Hold duration is the exit time minus the entry time, formatted to fit: seconds under two minutes, minutes under two hours, hours under two days, days under two weeks, and weeks beyond that.
R:R ratio compares the two distances you set on the Risk tab.
potential loss = |stop - entry| x quantity x multiplier
potential gain = |target - entry| x quantity x multiplier
R:R            = potential gain / potential loss
Actual R:R measures the result against the risk you took.
actual R:R = trade P&L / potential lossIt needs a stop loss on the trade. Without one there is nothing to divide by.
Unrealized P&L on an open trade marks the position to the current price.
unrealized = (mark price - entry price) x signed quantity x multiplier - commissionThe sign of the quantity carries the direction, so shorts work out correctly without a separate rule.
What you should see
Numbers that reconcile when you do the arithmetic yourself. If you export your trades to CSV from the Trades screen and total the P&L column, it should match Total P&L for the same filters exactly.
If it doesn’t work
- Your total does not match your broker statement. Check the date range first, then the account filter. A partial import is the next most likely cause.
- A metric shows a dash. That is deliberate. It means the bucket is empty, not that the value is zero.
- Numbers changed after an import. They should. Trades are cached for five minutes and an import invalidates the cache. See Refresh, caching and stale numbers.
Related
Still stuck? Email support@vexatrade.ai.