Add indicators to the chart
Turn on moving averages, VWAP, Bollinger Bands, RSI and MACD, change their settings and colours, and understand why your phone does not have the setup you built on your laptop.
On this page
What this does
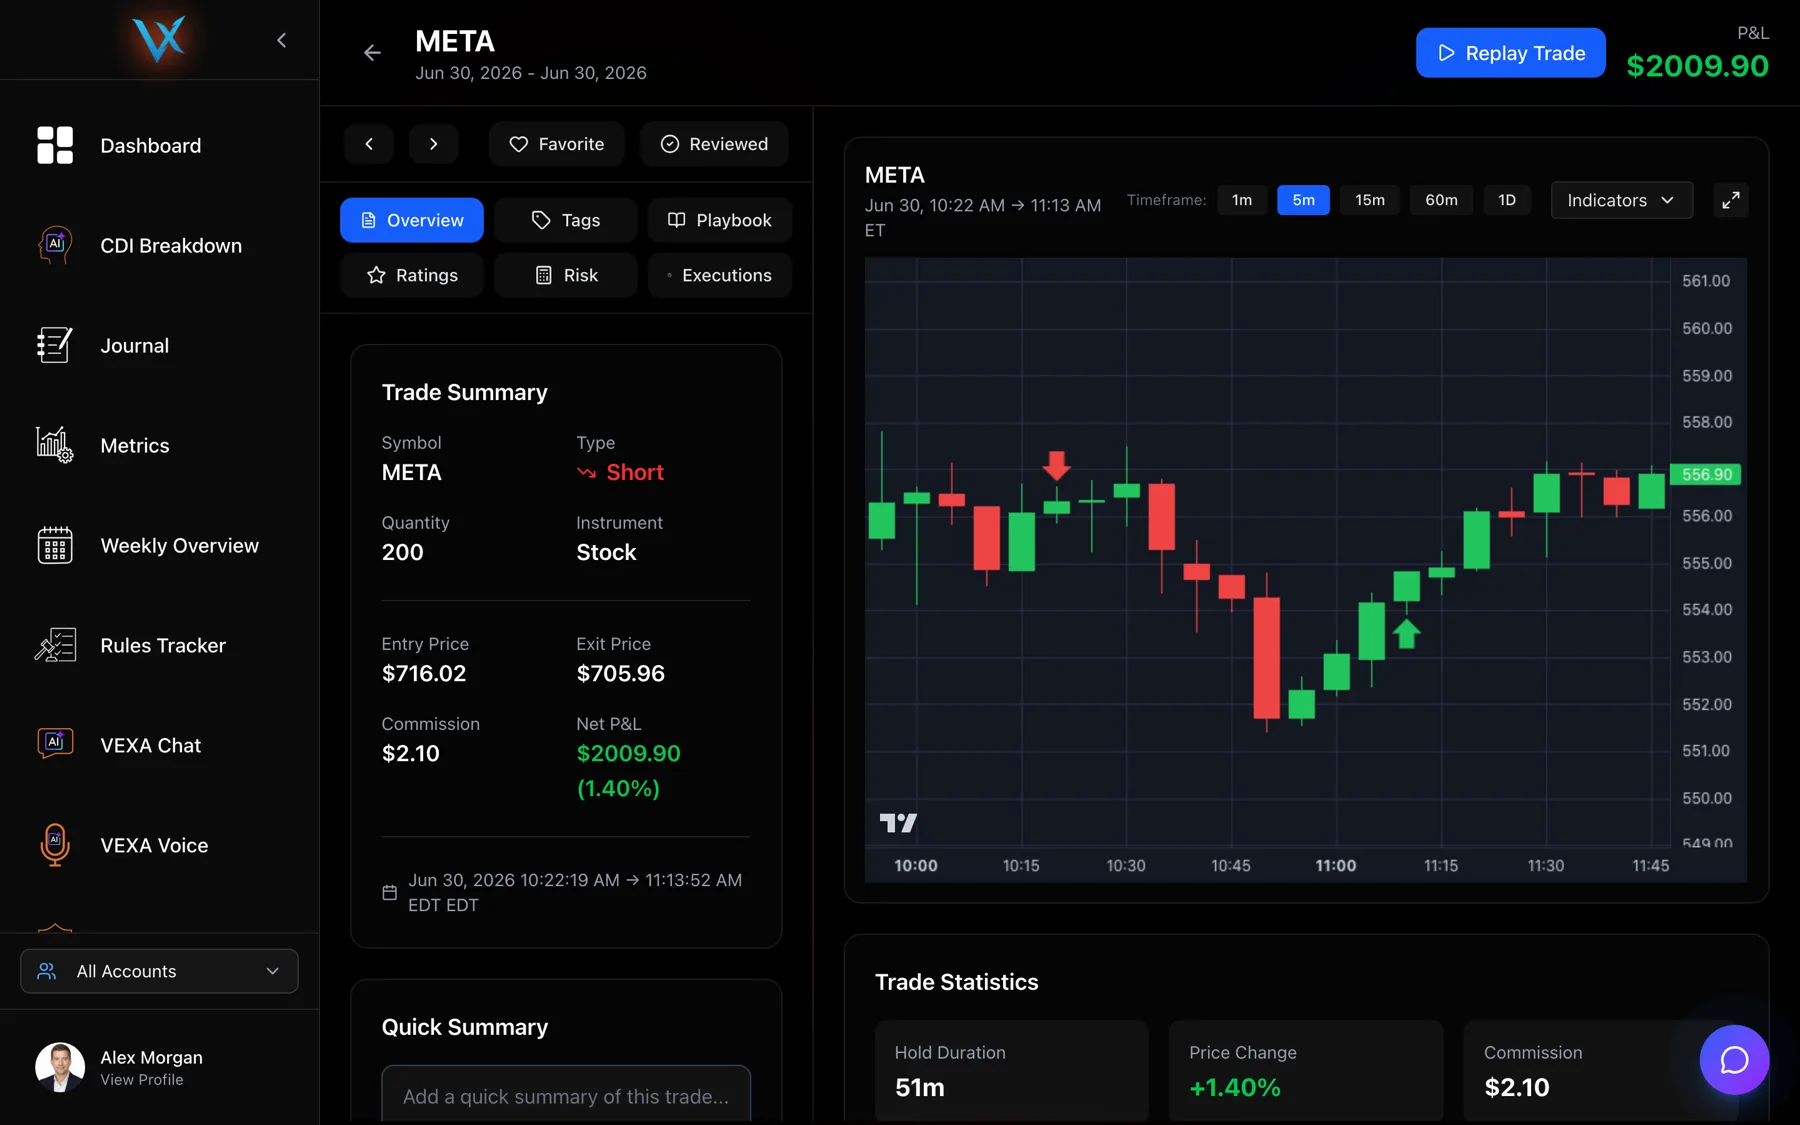
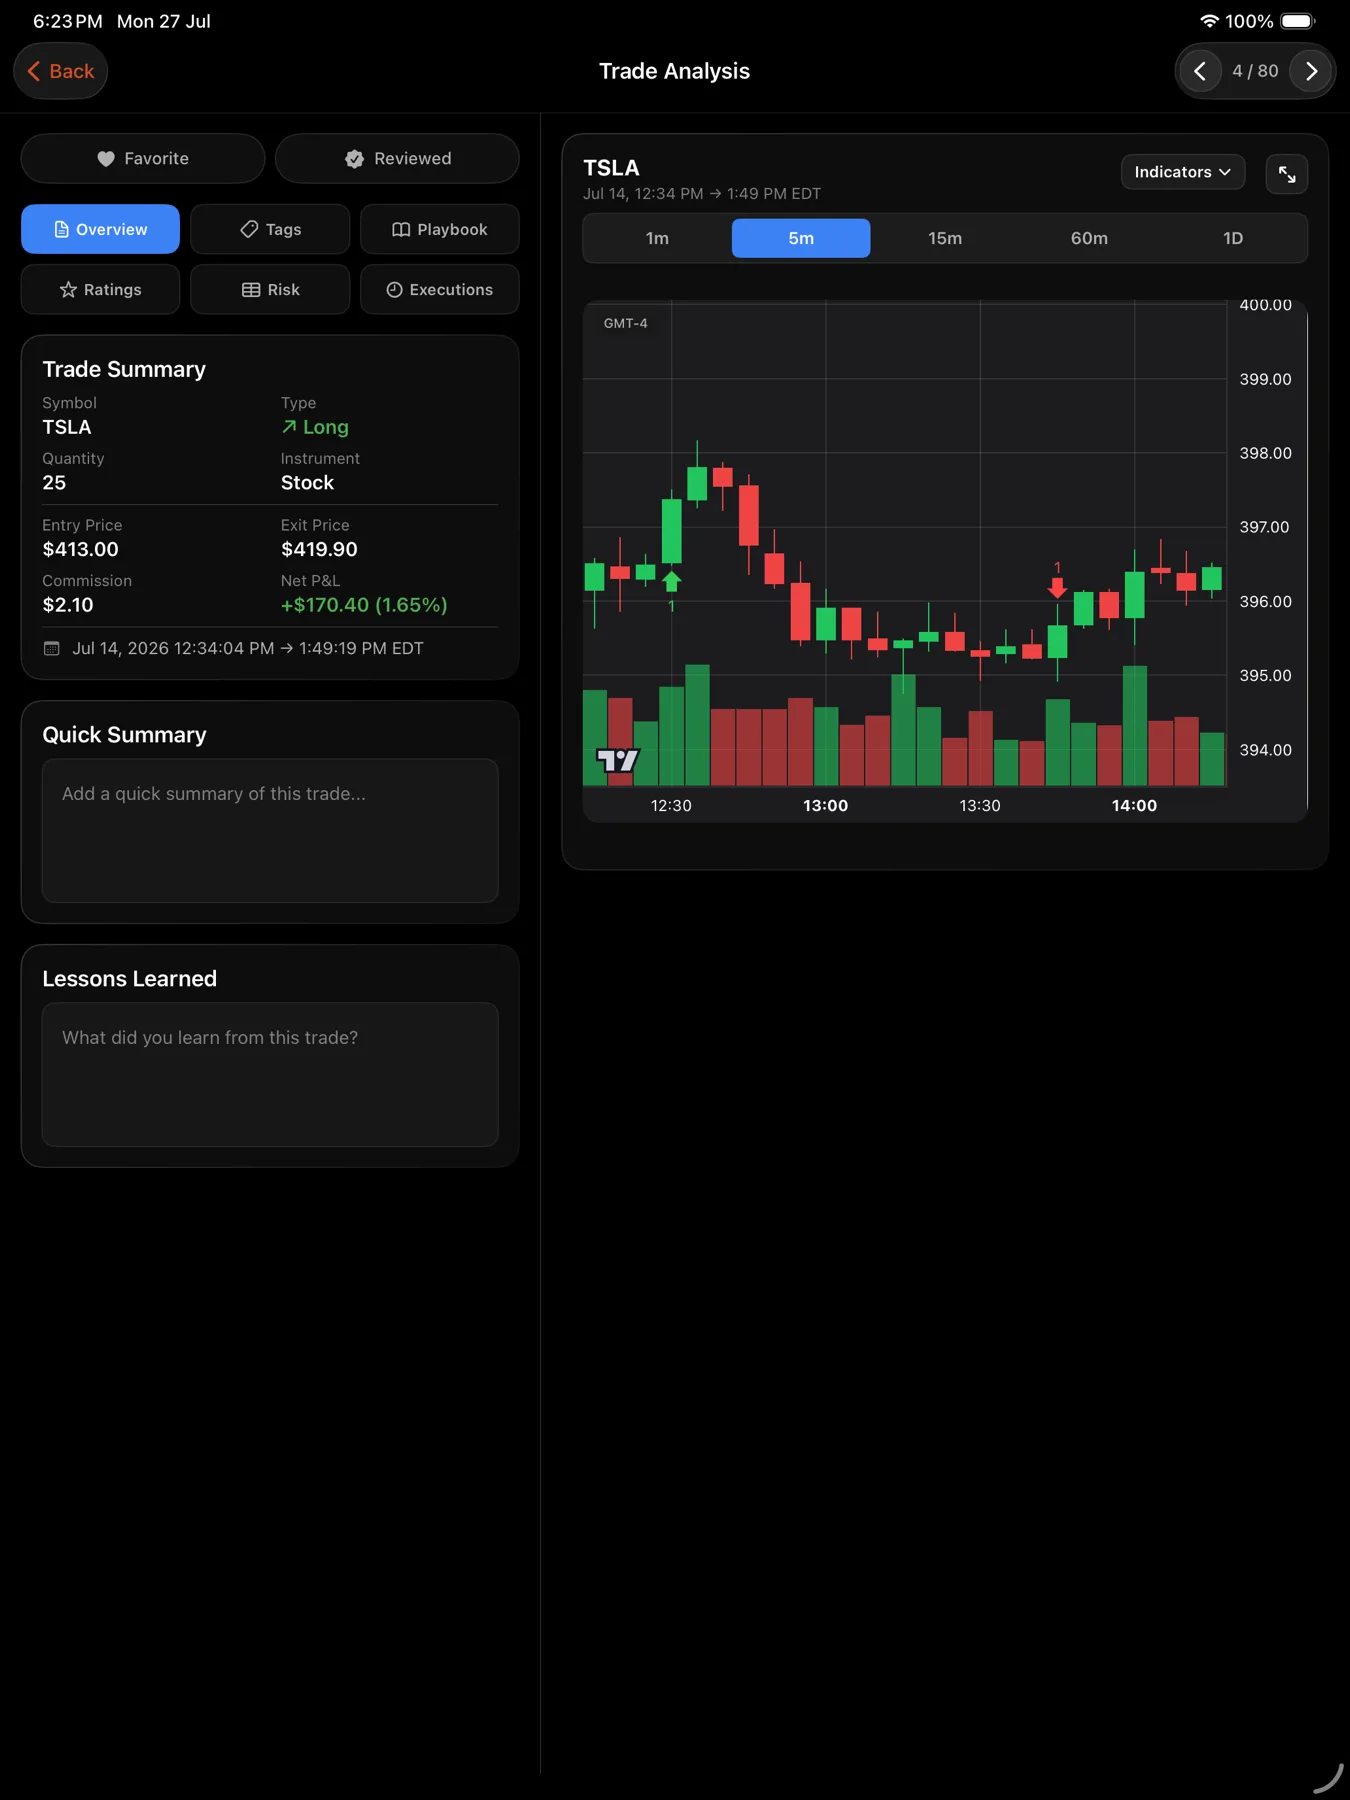
Indicators draw your own reference lines on the trade chart, so you can see whether price was above the 200 EMA when you entered, or whether you bought the upper Bollinger band.
Before you start
Indicators apply to every trade chart, not to one trade. Turning on the 20 SMA turns it on for every chart you open afterwards. There is no per-trade chart layout.
What you can add
Overlays draw on the price itself.
| Indicator | Default setting |
|---|---|
| SMA 1 | period 20 |
| SMA 2 | period 50 |
| SMA 3 | period 100 |
| SMA 4 | period 200 |
| EMA 1 | period 9 |
| EMA 2 | period 21 |
| EMA 3 | period 50 |
| EMA 4 | period 200 |
| Bollinger Bands | period 20, 2 standard deviations |
| VWAP | no settings |
| Volume | no settings |
Oscillators draw in their own pane under the price.
| Indicator | Default setting |
|---|---|
| RSI | period 14, with guide lines at 70 and 30 |
| MACD | fast 12, slow 26, signal 9 |
Each indicator has its own colour, and each one you turn on shows its live setting in the label, so
SMA 1 (20) becomes SMA 1 (34) once you change it.
Steps
- Open a trade from Trades or from a Journal day card.
- Click Indicators above the chart.
- Tick the indicators you want. They draw immediately.
- Click the gear next to one to change its settings. Periods take 1 to 200, the Bollinger standard deviation takes 0.1 to 5, and MACD takes fast 1 to 50, slow 1 to 100 and signal 1 to 50.
- Use the colour dot to pick from the 24 swatches.
- Reset All turns every indicator off.
- Open a trade from Metrics or from a Journal day.
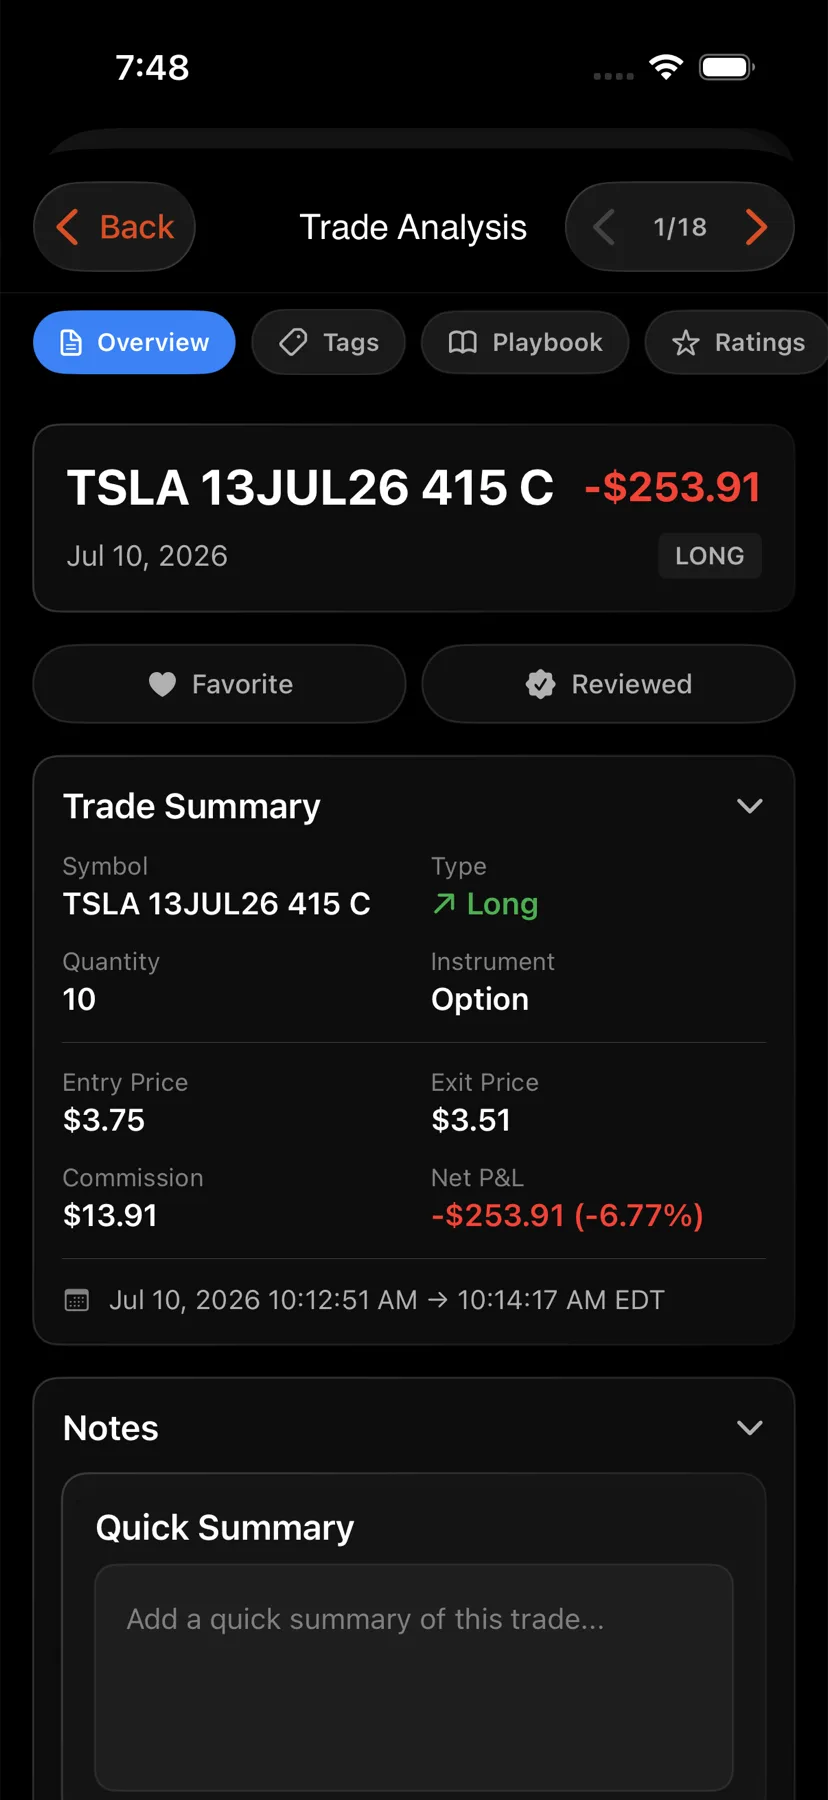
- Tap Indicators on the chart.
- Pick the indicators you want from the menu, which is grouped by family.
- Open a trade from Trades in the sidebar.
- Tap Indicators on the chart.
- Pick from the grouped menu.
- Open a trade from Metrics or from a Journal day.
- Tap Indicators on the chart section to open the checkbox list.
- Tick what you want: SMA 9, 20, 50 and 200, EMA 9, 20, 50 and 200, VWAP, Bollinger Bands, Volume, RSI and MACD.
- Open a trade from Trades in the sidebar.
- Tap Indicators on the chart section.
- Tick what you want from the same list as the phone.
The default periods are not identical everywhere
The web app’s four simple moving averages default to 20, 50, 100 and 200. The Android app’s default to 9, 20, 50 and 200. If a moving average sits in a different place on your phone than on your laptop, compare the periods before assuming the data is different.
What you should see
Lines appear on the chart as you tick them, and the RSI or MACD pane opens under the price when you turn one of those on. Open another trade and the same indicators are already on.
If it doesn’t work
Your indicators are gone. Either you are in a different browser or on a different device, or the browser’s site data was cleared. There is no way to recover the old layout. Set it up again.
Nothing draws when you tick an indicator. The chart has no candles to compute from. See Why a chart is blank.
A moving average line stops short of the left edge. A 200-period average needs 200 candles before it can plot its first point. Switch to a lower timeframe or a longer window.
Related
Still stuck? Email support@vexatrade.ai.